이전글에서 ELS Stack 구성하기 위해 설치를 진행했습니다.
이번 글에서는 Logstash의 설정을 알아보겠습니다.
[Server] MacOS X ELK Stack 구성하기 #1 설치
어플리케이션이 구동 중 발생하는 Exception을 모니터링할 수 있는 시스템을 위해 ELK Stack 환경을 구성하려고 합니다. ELS (ElK Stack) 구성 Java 8 Elasticsearch 7.1 Logstash 7.1 Kibana 7.1 Mac OS X에 ELK..
gigas-blog.tistory.com
우선 services로 등록된 목록을 조회합니다.
brew services list
logstash의 상태가 error로 나와있는데
Name          Status  User  Plist
elasticsearch started gigas /Users/gigas/Library/LaunchAgents/homebrew.mxcl.elasticsearch.plist
kibana        started gigas /Users/gigas/Library/LaunchAgents/homebrew.mxcl.kibana.plist
logstash      error   gigas /Users/gigas/Library/LaunchAgents/homebrew.mxcl.logstash.plist
logstash.log 파일을 보면 왜 error 가 발생하는지 확인이 가능합니다.
/usr/local/var/log/logstash.log
내용을 보면 pipeline.yml 설정파일이 비어있다고 나오는군요.
ERROR: Pipelines YAML file is empty. Location: /usr/local/Cellar/logstash/7.12.0/libexec/config/pipelines.yml
usage:
  bin/logstash -f CONFIG_PATH [-t] [-r] [] [-w COUNT] [-l LOG]
  bin/logstash --modules MODULE_NAME [-M "MODULE_NAME.var.PLUGIN_TYPE.PLUGIN_NAME.VARIABLE_NAME=VALUE"] [-t] [-w COUNT] [-l LOG]
  bin/logstash -e CONFIG_STR [-t] [--log.level fatal|error|warn|info|debug|trace] [-w COUNT] [-l LOG]
  bin/logstash -i SHELL [--log.level fatal|error|warn|info|debug|trace]
  bin/logstash -V [--log.level fatal|error|warn|info|debug|trace]
  bin/logstash --help
[2021-04-15T14:35:20,917][FATAL][org.logstash.Logstash    ] Logstash stopped processing because of an error: (SystemExit) exit
pipelines 파일을 열어보겠습니다.
oepn /usr/local/etc/logstash/pipelines.yml
or
vi /usr/local/etc/logstash/pipelines.yml
* deb 또는 rpm으로 설치를 진행하면 /etc/logstash/conf.d 디렉토리에 구성파일이 배치 됩니다. *
하지만 위와 같이 설치 하지 않았기에 이전글을 따라 설치하셨다면 /usr/local/etc/logstash 경로에 배치 됩니다.
공식문서는 아래와 같습니다.
www.elastic.co/guide/en/logstash/7.x/dir-layout.html
Logstash Directory Layout | Logstash Reference [7.x] | Elastic
Logstash Docker containers do not create log files by default. They log to standard output.
www.elastic.co
많은 라인의 설정 내용이 있지만 모두 주석처리가 되어있습니다.
주석을 제거하여 pipeline.id와 path.config를 수정하였습니다.
syslog.conf 는 조금 더 아래부분에서 새로 만들겠습니다.
# - pipeline.id: test
- pipeline.id: sample

#   path.config: "/tmp/logstash/*.config"
path.config: "/usr/local/etc/logstash/syslog.conf"
/usr/local/etc/logstash/ 경로에는 pipeline.yml 뿐만아니라 아래처럼 몇가지 파일들이 기본으로 있습니다.
logstash를 실행하려면 conf 파일이 필요한데 기본적으로 logstash-sample.conf 설정파일이 샘플로 들어있습니다.
jvm.options
log4j2.properties
logstash-sample.conf
logstash.yml
pipelines.yml
startup.options
/usr/local/etc/logstash/logstash-sample.conf
샘플 conf 파일은 아래와 같이 구성되어있습니다.
# Sample Logstash configuration for creating a simple
# Beats -> Logstash -> Elasticsearch pipeline.

input {
  beats {
    port => 5044
  }
}

output {
  elasticsearch {
    hosts => ["http://localhost:9200"]
    index => "%{[@metadata][beat]}-%{[@metadata][version]}-%{+YYYY.MM.dd}"
    #user => "elastic"
    #password => "changeme"
  }
}
기존파일도 사용가능하고 새로운 파일을 만들어서 연결도 가능합니다.
syslog.conf 파일을 만들어 보겠습니다.
vi /usr/local/etc/logstash/syslog.conf
MacOS X의 로그를 보여줄 수 있도록 file을 읽는 설정과 filter 설정으로 message를 만들었습니다.
input {
  file {
    path => [ "/var/log/*.log", "/var/log/messages", "/var/log/syslog" ]
    type => "syslog"
  }
}

filter {
  if [type] == "syslog" {
    grok {
      match => { "message" => "%{SYSLOGTIMESTAMP:syslog_timestamp} %{SYSLOGHOST:syslog_hostname} %{DATA:syslog_program}(?:\[%{POSINT:syslog_pid}\])?: %{GREEDYDATA:syslog_message}" }
      add_field => [ "received_at", "%{@timestamp}" ]
      add_field => [ "received_from", "%{host}" ]
    }
    syslog_pri { }
    date {
      match => [ "syslog_timestamp", "MMM  d HH:mm:ss", "MMM dd HH:mm:ss" ]
    }
  }
}

output {
  elasticsearch {
    hosts => ["127.0.0.1:9200"]
    index => "syslog-demo"
  }
  stdout { codec => rubydebug }
}
새로 생성한 syslog.conf 파일의 구성을 로드 합니다.
별도 설정파일없이 -f 옵션으로 시작하고 있기 때문에 brew services 로 등록되지는 않습니다.
/usr/local/bin/logstash -f syslog.conf
Using JAVA_HOME defined java: /Library/Java/JavaVirtualMachines/jdk-10.0.2.jdk/Contents/Home
Java HotSpot(TM) 64-Bit Server VM warning: Option UseConcMarkSweepGC was deprecated in version 9.0 and will likely be removed in a future release.
Sending Logstash logs to /usr/local/Cellar/logstash/7.12.0/libexec/logs which is now configured via log4j2.properties
[2021-04-15T12:21:23,862][INFO ][logstash.runner          ] Log4j configuration path used is: /usr/local/Cellar/logstash/7.12.0/libexec/config/log4j2.properties
[2021-04-15T12:21:23,874][INFO ][logstash.runner          ] Starting Logstash {"logstash.version"=>"7.12.0", "jruby.version"=>"jruby 9.2.13.0 (2.5.7) 2020-08-03 9a89c94bcc Java HotSpot(TM) 64-Bit Server VM 10.0.2+13 on 10.0.2+13 +indy +jit [darwin-x86_64]"}
[2021-04-15T12:21:24,004][WARN ][logstash.config.source.multilocal] Ignoring the 'pipelines.yml' file because modules or command line options are specified
[2021-04-15T12:21:24,036][INFO ][logstash.agent           ] No persistent UUID file found. Generating new UUID {:uuid=>"31d249d3-662b-4761-a658-482e72562d5c", :path=>"/usr/local/Cellar/logstash/7.12.0/libexec/data/uuid"}
[2021-04-15T12:21:24,642][INFO ][logstash.agent           ] Successfully started Logstash API endpoint {:port=>9600}
[2021-04-15T12:21:25,664][INFO ][org.reflections.Reflections] Reflections took 38 ms to scan 1 urls, producing 23 keys and 47 values
[2021-04-15T12:21:26,763][INFO ][logstash.outputs.elasticsearch][main] Elasticsearch pool URLs updated {:changes=>{:removed=>[], :added=>[http://127.0.0.1:9200/]}}
[2021-04-15T12:21:26,924][WARN ][logstash.outputs.elasticsearch][main] Restored connection to ES instance {:url=>"http://127.0.0.1:9200/"}
[2021-04-15T12:21:27,123][INFO ][logstash.outputs.elasticsearch][main] ES Output version determined {:es_version=>7}
[2021-04-15T12:21:27,126][WARN ][logstash.outputs.elasticsearch][main] Detected a 6.x and above cluster: the `type` event field won't be used to determine the document _type {:es_version=>7}
[2021-04-15T12:21:27,137][INFO ][logstash.outputs.elasticsearch][main] New Elasticsearch output {:class=>"LogStash::Outputs::ElasticSearch", :hosts=>["//127.0.0.1:9200"]}
[2021-04-15T12:21:27,202][INFO ][logstash.outputs.elasticsearch][main] Using a default mapping template {:es_version=>7, :ecs_compatibility=>:disabled}
[2021-04-15T12:21:27,262][INFO ][logstash.outputs.elasticsearch][main] Index Lifecycle Management is set to 'auto', but will be disabled - Index Lifecycle management is not installed on your Elasticsearch cluster
[2021-04-15T12:21:27,263][INFO ][logstash.outputs.elasticsearch][main] Attempting to install template {:manage_template=>{"index_patterns"=>"logstash-*", "version"=>60001, "settings"=>{"index.refresh_interval"=>"5s", "number_of_shards"=>1}, "mappings"=>{"dynamic_templates"=>[{"message_field"=>{"path_match"=>"message", "match_mapping_type"=>"string", "mapping"=>{"type"=>"text", "norms"=>false}}}, {"string_fields"=>{"match"=>"*", "match_mapping_type"=>"string", "mapping"=>{"type"=>"text", "norms"=>false, "fields"=>{"keyword"=>{"type"=>"keyword", "ignore_above"=>256}}}}}], "properties"=>{"@timestamp"=>{"type"=>"date"}, "@version"=>{"type"=>"keyword"}, "geoip"=>{"dynamic"=>true, "properties"=>{"ip"=>{"type"=>"ip"}, "location"=>{"type"=>"geo_point"}, "latitude"=>{"type"=>"half_float"}, "longitude"=>{"type"=>"half_float"}}}}}}}
[2021-04-15T12:21:27,293][INFO ][logstash.outputs.elasticsearch][main] Installing elasticsearch template to _template/logstash
[2021-04-15T12:21:27,362][INFO ][logstash.javapipeline    ][main] Starting pipeline {:pipeline_id=>"main", "pipeline.workers"=>12, "pipeline.batch.size"=>125, "pipeline.batch.delay"=>50, "pipeline.max_inflight"=>1500, "pipeline.sources"=>["/usr/local/etc/logstash/syslog.conf"], :thread=>"#<Thread:0x39654f6f run>"}
[2021-04-15T12:21:28,430][INFO ][logstash.javapipeline    ][main] Pipeline Java execution initialization time {"seconds"=>1.07}
[2021-04-15T12:21:28,709][INFO ][logstash.inputs.file     ][main] No sincedb_path set, generating one based on the "path" setting {:sincedb_path=>"/usr/local/Cellar/logstash/7.12.0/libexec/data/plugins/inputs/file/.sincedb_7a95d797537896d7bc2d7c8449373a40", :path=>["/var/log/*.log", "/var/log/messages", "/var/log/syslog"]}
[2021-04-15T12:21:28,740][INFO ][logstash.javapipeline    ][main] Pipeline started {"pipeline.id"=>"main"}
[2021-04-15T12:21:28,774][INFO ][filewatch.observingtail  ][main][976adb32015ef413e59b22b156956b8bec525ed6230bfb57972bc53d08535932] START, creating Discoverer, Watch with file and sincedb collections
[2021-04-15T12:21:28,792][INFO ][logstash.agent           ] Pipelines running {:count=>1, :running_pipelines=>[:main], :non_running_pipelines=>[]}
{
    "syslog_severity_code" => 5,
                 "message" => "Apr 15 12:21:35 gigasui-MacBookPro Google Chrome Helper[6300]: Libnotify: notify_register_coalesced_registration failed with code 9 on line 2835",
              "syslog_pid" => "6300",
             "received_at" => "2021-04-15T03:21:36.161Z",
              "@timestamp" => 2021-04-15T03:21:35.000Z,
         "syslog_facility" => "user-level",
          "syslog_message" => "Libnotify: notify_register_coalesced_registration failed with code 9 on line 2835",
                "@version" => "1",
         "syslog_hostname" => "gigasui-MacBookPro",
                    "host" => "gigasui-MacBookPro.local",
          "syslog_program" => "Google Chrome Helper",
           "received_from" => "gigasui-MacBookPro.local",
                    "path" => "/var/log/system.log",
    "syslog_facility_code" => 1,
         "syslog_severity" => "notice",
                    "type" => "syslog",
        "syslog_timestamp" => "Apr 15 12:21:35"
}
편한 관리를 위해 brew services로 등록해보겠습니다.
pipeline.yml 에 설정된 conf 파일을 읽도록 처리가 되었기 때문에 bres services list 명령어로 상태 관리를 할 수 있습니다.
brew services start logstash
그리고 Logstash 자체도 REST API를 제공하고 있습니다.
정상적으로 실행이 되었는지 확인하기 위해 기본 설정된 9600 포트로 접속해봅니다.
curl localhost:9600/_node?pretty
Logstash설정이 완료 되었기 때문에 Kibana를 통해 시각화가 필요합니다.
설정에 되어있는 index가 자동으로 생성되지만 수동으로 등록 할 수도 있습니다.
Kibana 스택 관리 메뉴에서 index를 등록합니다.
http://localhost:5601/app/home#/
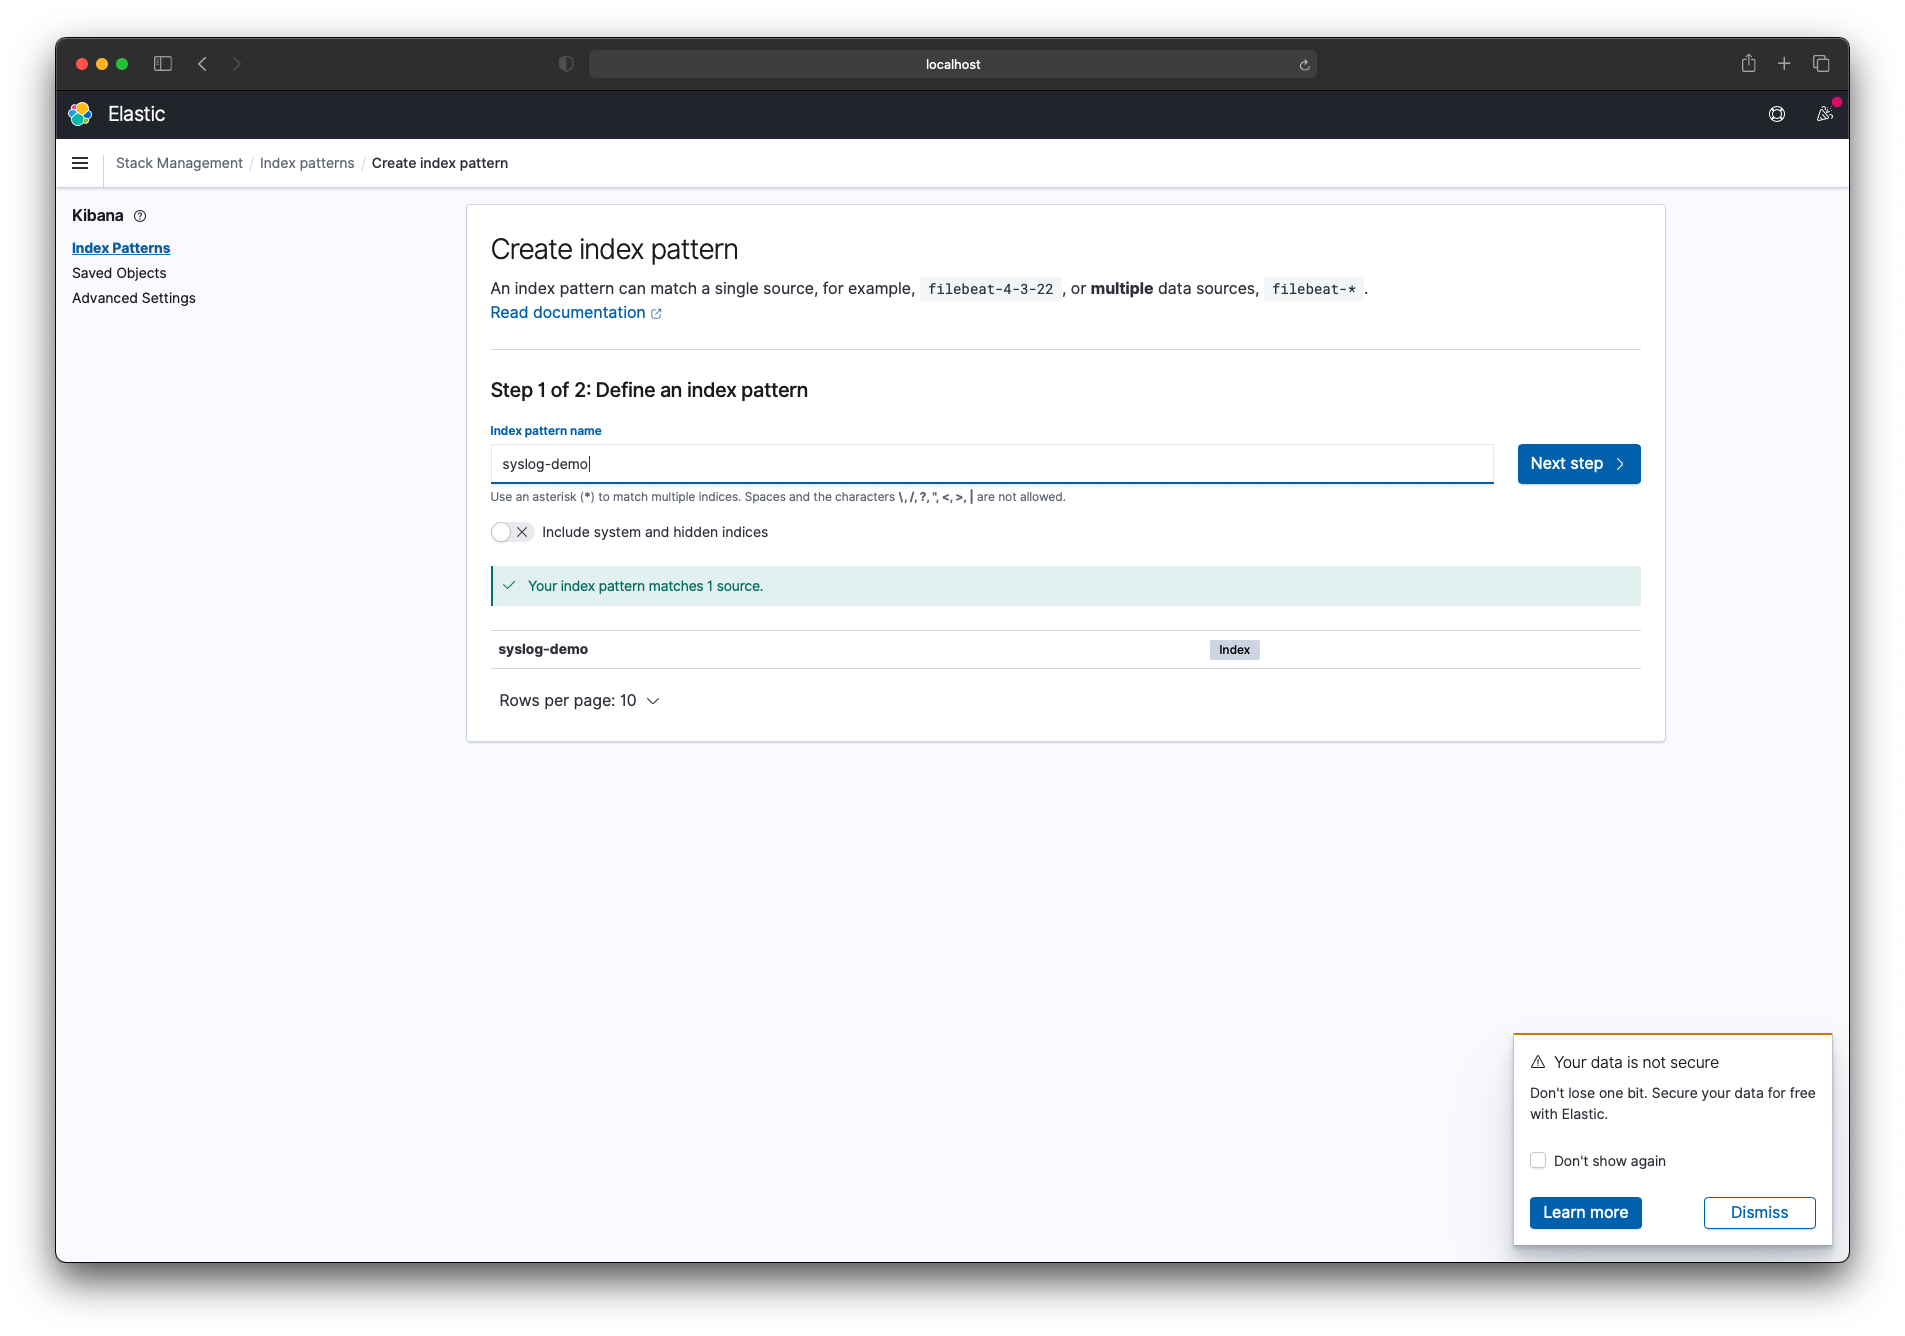
conf 파일의 output에 설정된 elasticsearch-> index 로 색인 등록을 할 수 있습니다.
syslog-demo를 입력하면 해당 인덱스를 찾았다는 문구가 보여지게 됩니다.
확인 후 Next step 버튼을 클릭합니다.
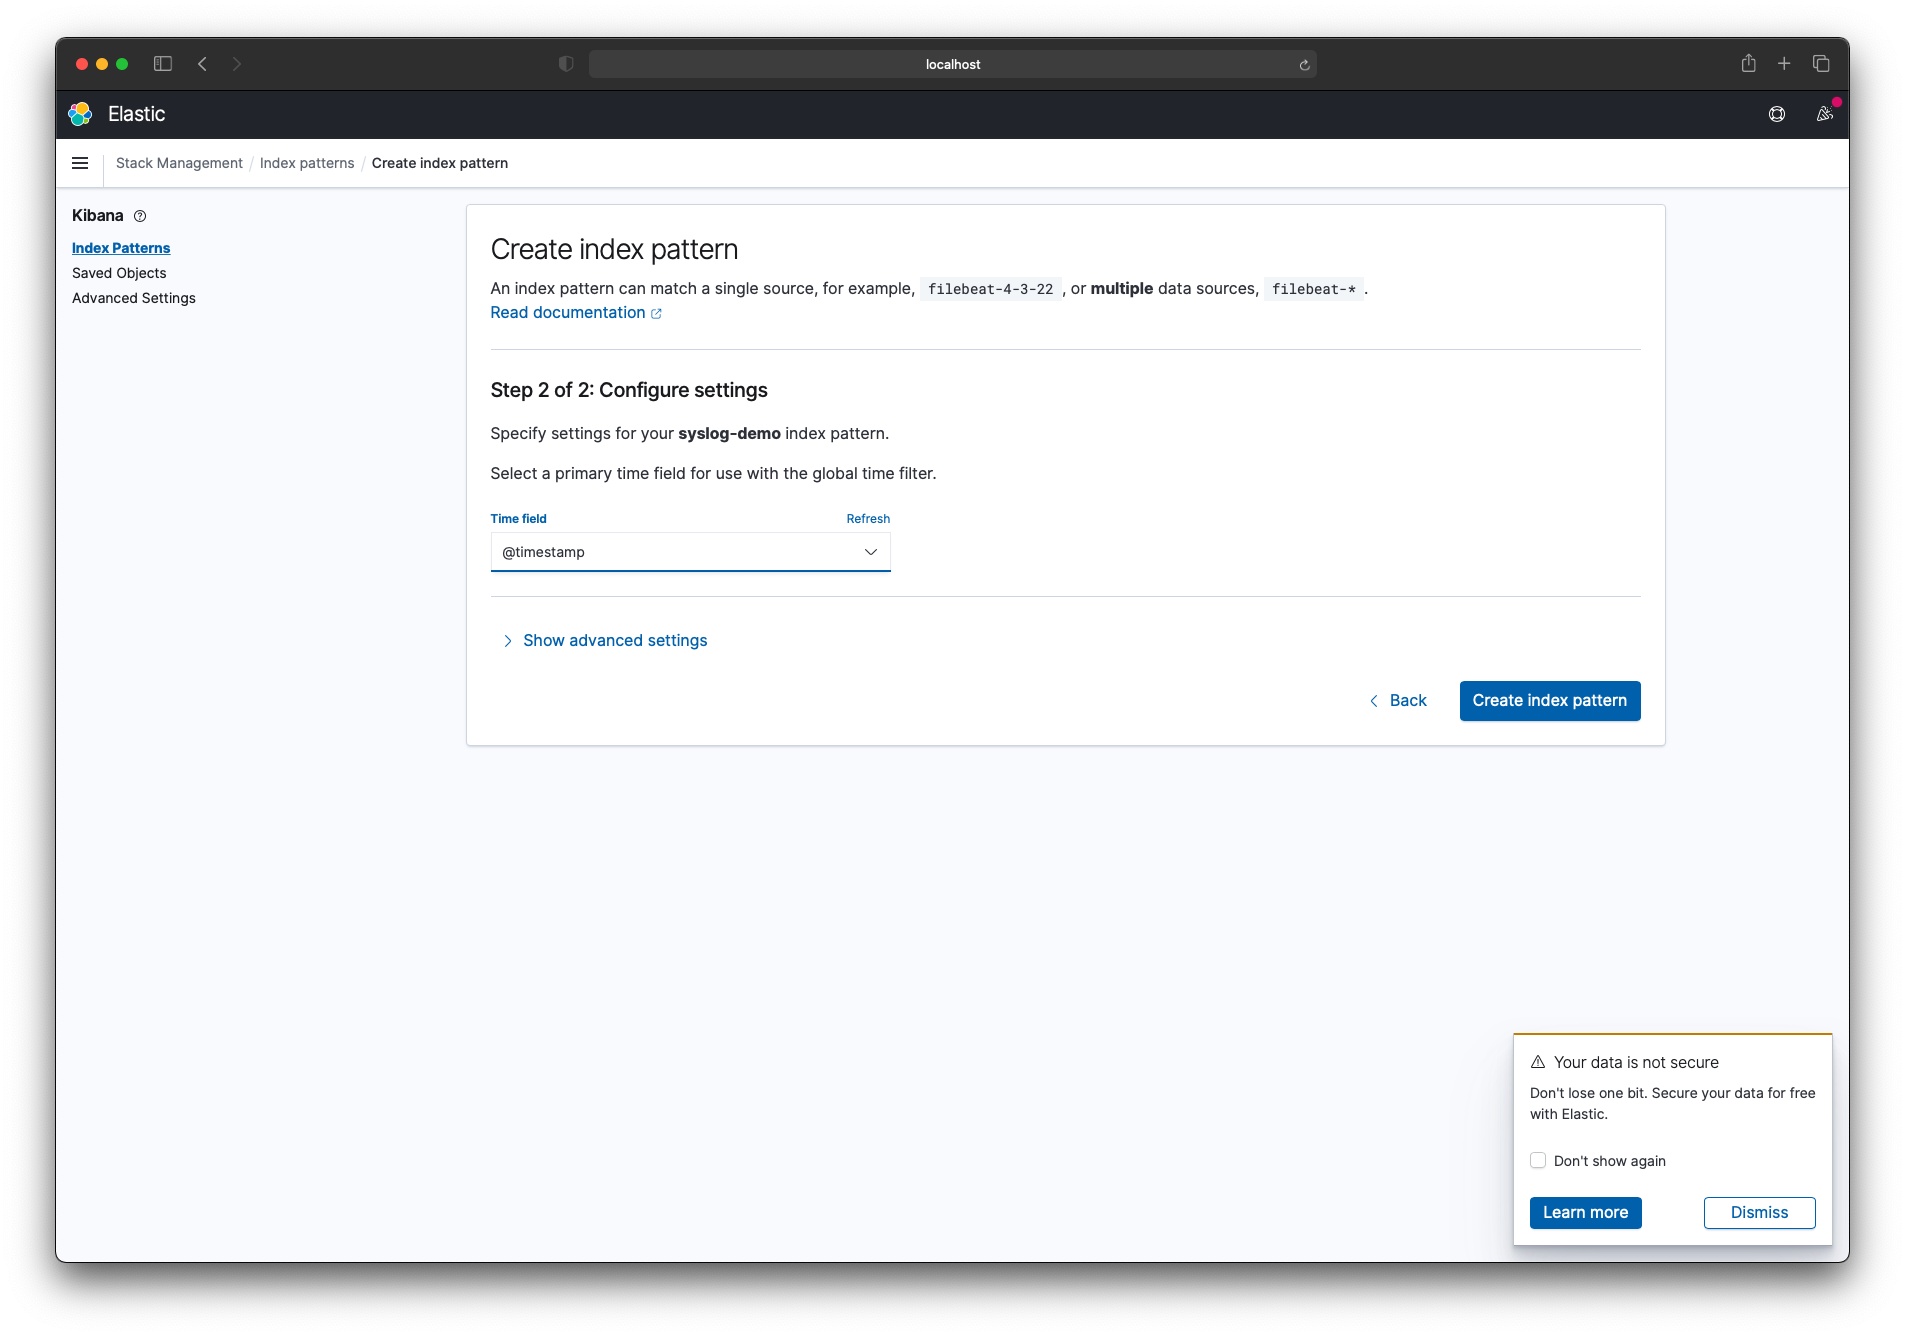
시간 필터 필드 이름으로 @timestamp 필드를 선택하고 'Create index pattern' 버특을 클릭합니다.
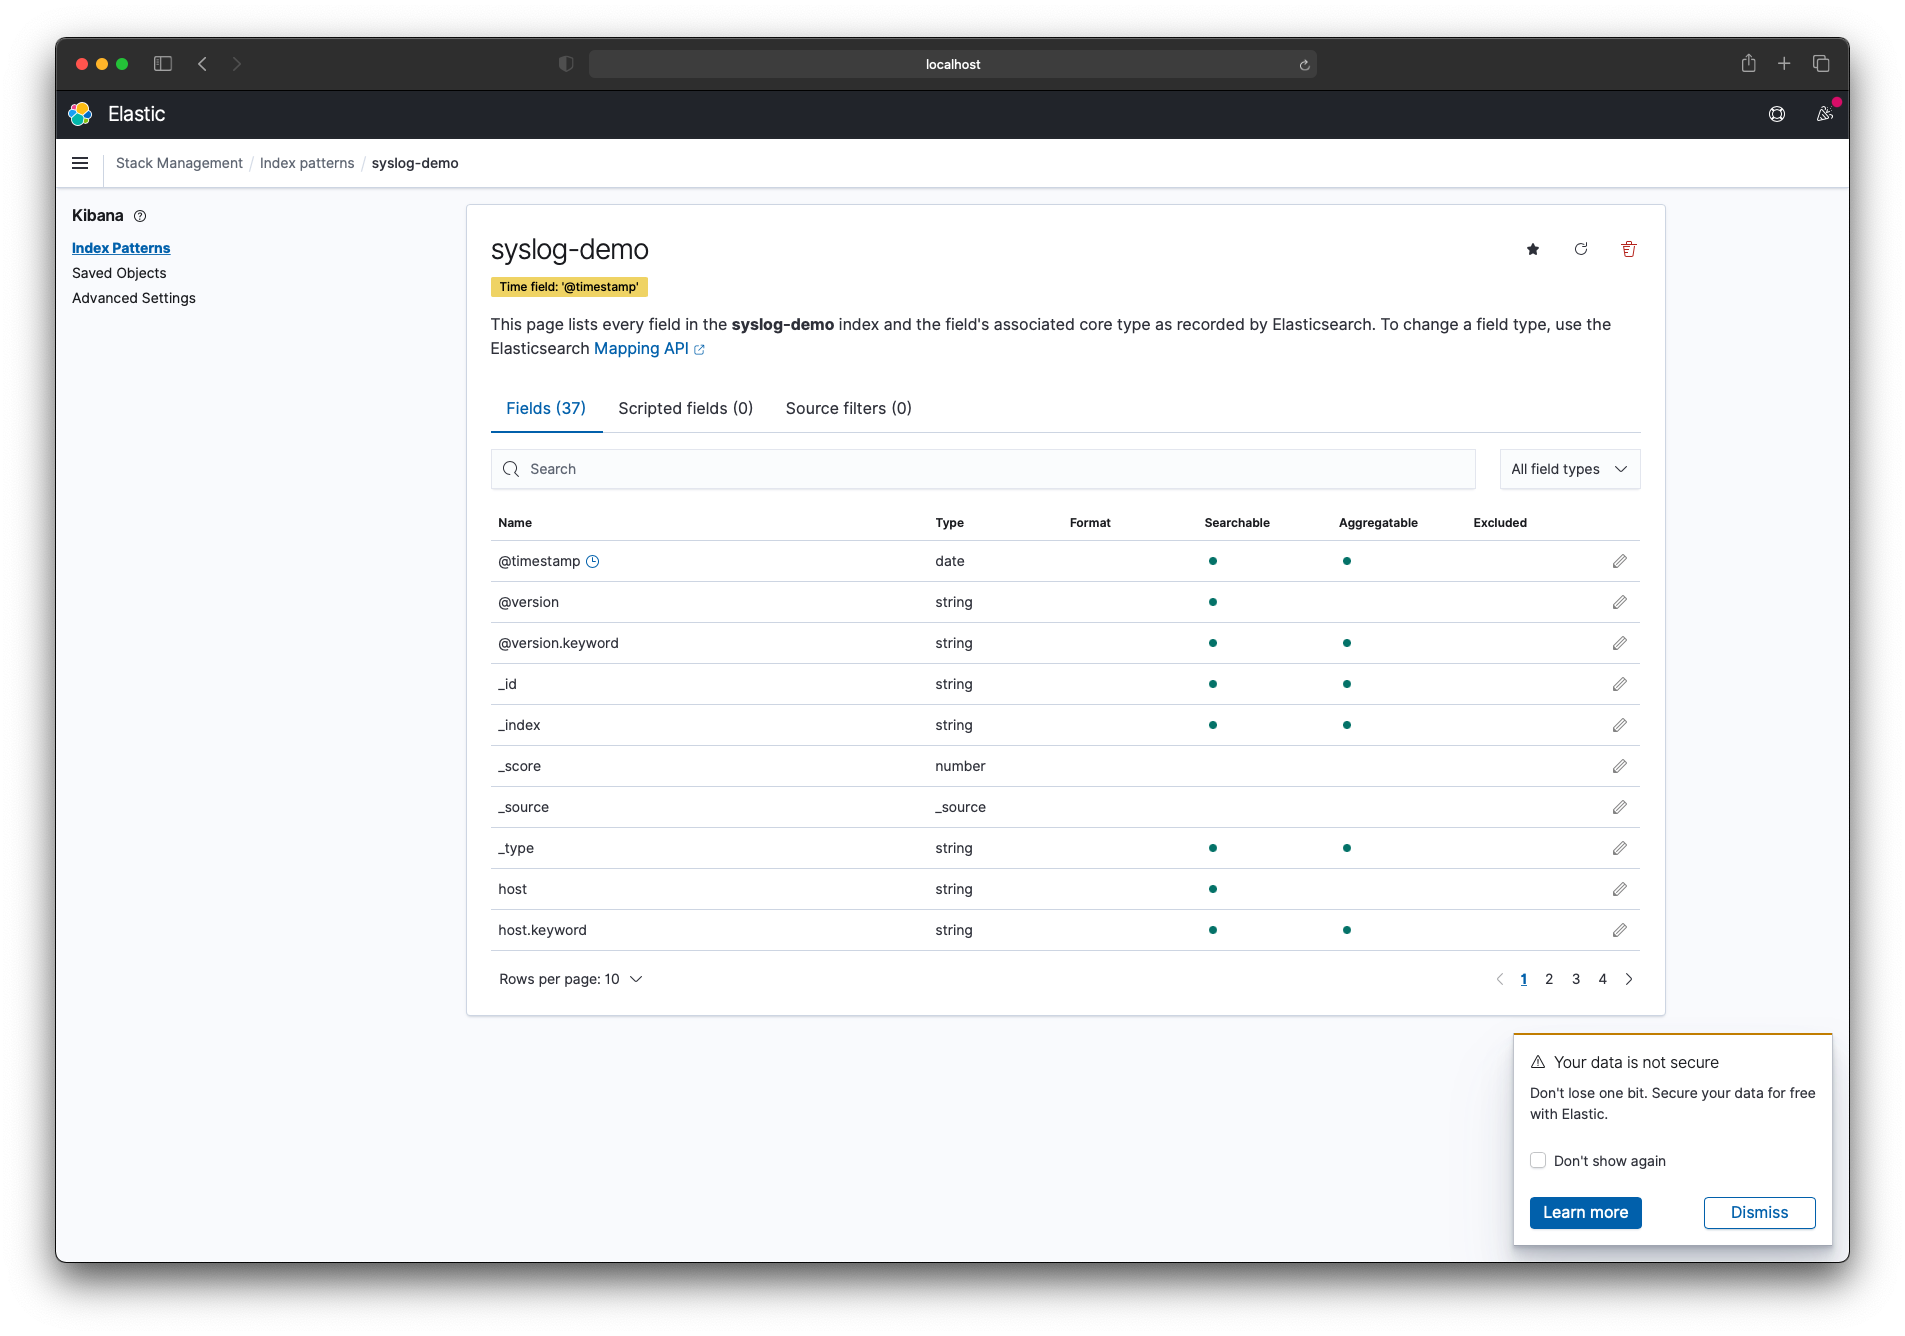
정상적으로 index pattern 등록이 되었습니다.
Discover 페이지를 열면 Kibana에서 syslog 데이터를 볼 수 있습니다.
날짜별로 필터도 가능하며 검색을 통해서 빠르게 조회가 가능합니다.
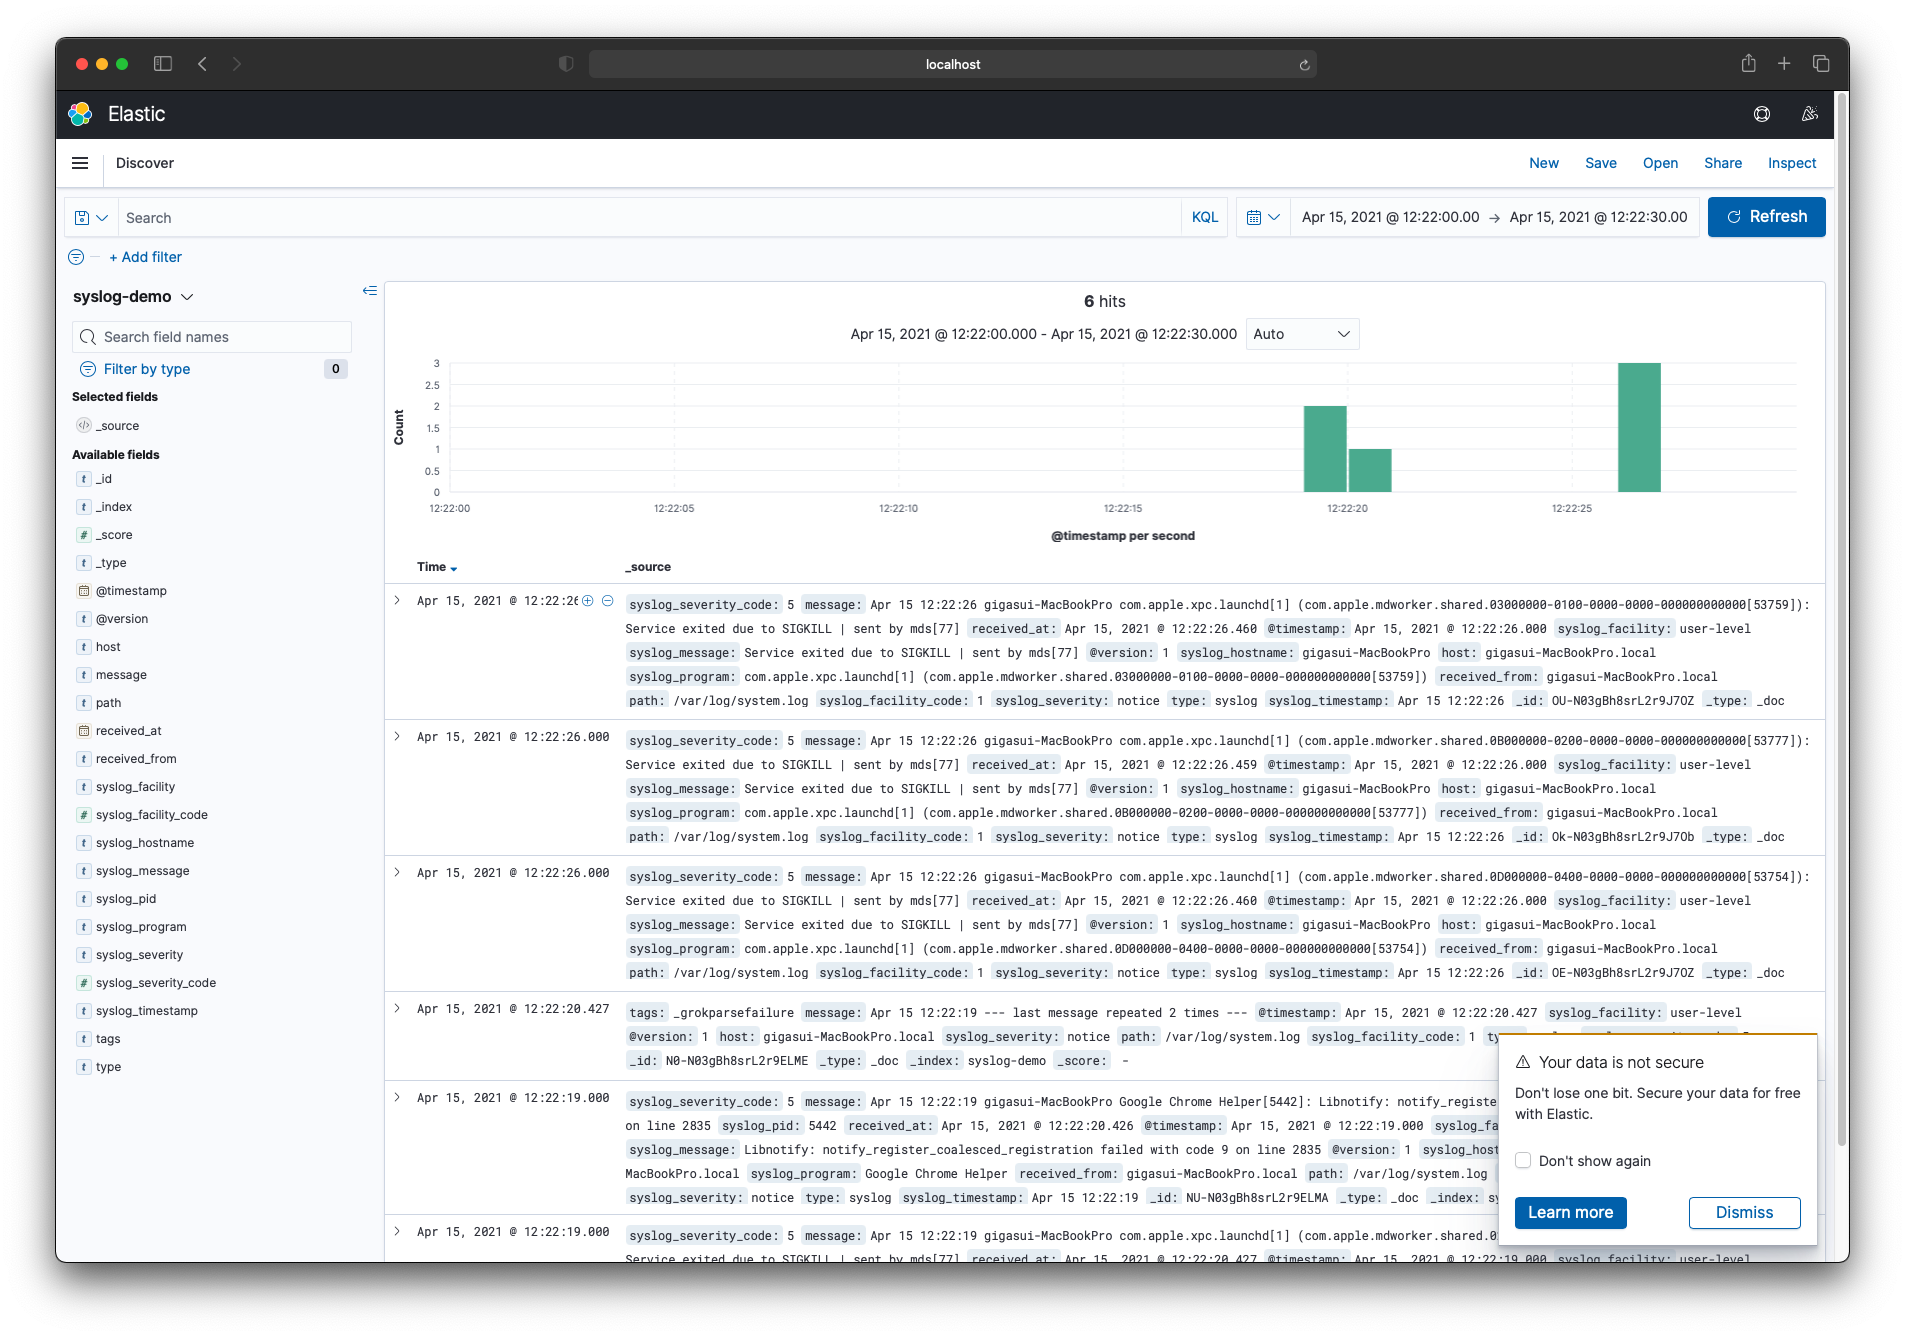
이렇게 Kibana를 통해서 로그를 시각화 하도록 구성을 해보았습니다.
'프로그래밍 > Server' 카테고리의 다른 글
| [Nginx] 502 Bad Gateway (13: Permission denied) (0) | 2023.11.14 |
|---|---|
| [Server] MacOS X ELK Stack 구성하기 #1 설치 (2) | 2021.04.15 |
| [Server] Linux 운영체제 및 버전 확인 방법 (0) | 2021.04.15 |
| [CentOS] Nginx 설정 (2) | 2020.11.18 |
| [CentOS] yum firewall 설치 (0) | 2020.07.26 |